Heat Bars
Heat bar fields show data as colored segments of one bar, useful for showing proportions, progress, and more. Heat Bars are built using either a Related Table or using multiple Numeric fields.
Example
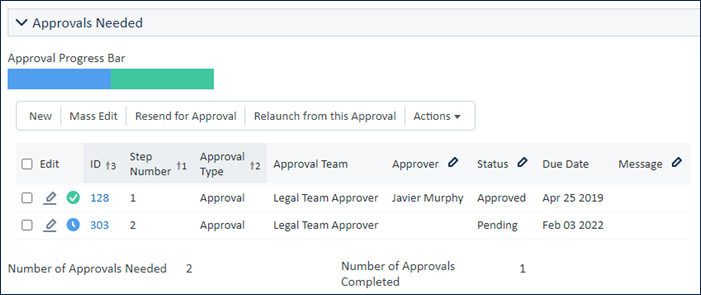
For example, you might build a Heat Bar to show data from a Related Table at a glance. In this example, the Approval Progress Bar shows data from a Related Table, segmented by the Status field value.
Creating a Heat Bar
Because a Heat Bar is a graphical representation of data from other fields, make sure you have already created the Related Table or the Numeric fields you want to show in your Heat Bar before you begin.
When your other fields have been configured:
- Click Setup [Table] and go to the Fields tab.
- In the New drop-down menu, select Heat Bar.
- Give your heat bar a label and name, and add any admin notes you want to add.
- Select whether to use a Related Table or Multiple Numeric Fields to define your heat bar values. If you choose Related Table, choose the table from the drop-down list.
- Click Next. Note that after you click Next, you can't change your heat bar type from Related Table to Multiple Numeric Fields or vice versa. If you selected the wrong one by mistake, you must click Cancel and start again.
If you're using a Related Table:
- Select the field you want to use to segment the heat bar. For example, if your related table shows tasks, you might use a Status field.
- Choose whether to use all values or to filter them with a saved search.
- Choose an option for the color proportions. In some cases, you want to show the count of each field as a proportion of the total count; in other cases, it makes more sense to use the sum of a field value. For example, if your heat bar shows training information and the courses differ in length, you might want to show it as a proportion of the total hours the training will take, rather than the count of courses.
- Select the calculated result fields to be created. You must create a calculated result field for each item you want to include in the heat bar.
- Rename the new calculated result fields as needed. Remember that these will appear on the Fields tab with all other fields in the table.
- Choose whether to run the calculation for all existing records. This will populate your heat bar for each existing record, which might take some time depending on the amount of existing records.
- Complete the Options and Permissions tabs as desired, then go to the Display tab.
If you're using Multiple Numeric Fields:
- Use Ctrl+Click to select all the fields you want to use in the heat bar.
- Complete the Options and Permissions tabs as desired, then go to the Display tab.
Now that you've defined the data source for the segments, you can complete the Display tab:
Set the display settings for each segment by clicking Choose Color.
Consider how the colors will look next to each other. Segments appear in the order of the fields here. You can click and drag to rearrange the order of the fields.
If necessary, edit the label for each segment.
- Choose what shows in the tooltip when users mouse over a segment of the bar. You can choose to show the labels you defined in step 2; the numerical value of the segment; both; or no tooltip at all.
- Choose when to show numerical values on the bar, if at all.
- Set the bar width and height. This might require some trial and error. Make sure to test your heat bar everywhere it will appear, including any views, dashboards, or widgets.
- If applicable, choose the locale setting for multiple language display.
- Complete the remaining standard display options as desired.
Showing the Heat Bar
You can include the Heat Bar in the record layout, table view, and more. Heat bar values are refreshed whenever a record is saved.