Use the The following sections article serves as a diagnostics checklist to investigate server performance issues. If you are experiencing performance issues.
Run performance_analysis.py
, review the sections below to diagnose the cause of the issue. If you are unable to identify the performance issue on your own, escalate the issue to our support team. For more information, see Escalate an Issue.
| Info | ||
|---|---|---|
| ||
Depending on your release version and the method of investigating server performance, you may need the following:
|
Run Performance Analysis
Before completing any other steps to investigate server performance issues, run the performance analysis Python The first step in diagnosing server performance issues is to run the performance analysis python script, performance_analysis.py.
...
In most cases, you need access to the server file system to run this script.
...
However, in any release later than 2019_01 r195525 dated after
...
08/01
...
/2019, you can run the script
...
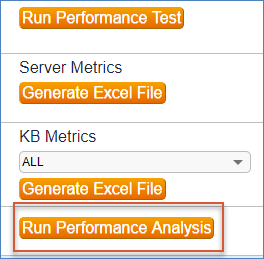
by opening the administrator console, going to Debugging > Performance, and clicking Run Performance Analysis:
...
If your system is running an earlier release, you can run the script manually from the command line. Download the script here: https: //www.agiloft.com/public/ performance_analysis.py.
This script is designed to identify the specific activities that may be causing performance problems. It checks the CPU and memory utilization and produces a summary of events and activities for the day. The summary can help determine if an incorrectly configured rule or action should be further investigated be investigated as a potential cause of performance issues.
| Note |
|---|
When |
...
you run the script from the admin console, it captures activities |
...
beginning at 12:01am. |
...
When you run the script manually, you can configure the time frame to use a different starting point |
...
. |
...
Diagnose Issues on a Self-hosted
...
Server
The following sections are helpful to investigate server performance issues for customers who host their
instance(s) on their own servers. when you host Companyname
| Companyname |
|---|
Verify the Hardware Configuration
...
Complete these steps to verify your hardware configuration:
- Check your hardware configuration to
...
- confirm that it follows
System Requirements for hardware.Companyname
...
- Run a performance test through the Administrator Consoleto validate the hardware configuration.
...
...
- for additional details on this performance test and other
...
- aspects of your system that can affect performance.
Check CPU and Memory Utilization
To further investigate any CPU and memory utilization issues reported by the performance_analysis.py script, and to determine if a third-party application is taxing those resources, use the following techniques, depending on your operating system:
- For Linux servers, use the “uptime”
uptime,top, “top” and “free”freecommands. - For Windows servers, use the Task Manager or the Resource Monitor.
...
If you determine that a third-party application is responsible for the high load or memory utilization, then review the logs log files or thread dumps for that application.
Run
| Companyname |
|---|
...
Diagnostics
Jboss is the primary process for the
application. On Linux servers, the process appears as “Companyname java”. On On Windows servers, it appears as “ewjboss. Running diagnostics on the process and reviewing log files can help identify any performance issues.
Thread Dump
ewjboss”. If a performance problem issue occurs while executing a particular set of steps in the UIinterface, repeat the steps and take a Jboss thread dump at the same time. To take a thread dump in tandem by running , run the following command on the server as root or an administrator, substituting the directory where
is installed for [AGILOFT_HOME]:Companyname
| Code Block |
|---|
[AGILOFT_HOME]/bin/ew-control -d |
...
| Companyname |
|---|
...
tr |
Take two or three thread dumps and review them to isolate the cause of the performance issue.
Heap Dump
If the
logs show memory-related problems, such as "OutOfMemory" errors, then a heap dump may be necessary.Companyname
| Warning |
|---|
Heap dumps are resource intensive and can take hours to complete. Either run Run them outside of business hours or be ready to kill end the operation if it is severely affecting performance. |
To perform a heap dump, run the following command on the server as root or an administrator, substituting the directory where
is installed for [AGILOFT_HOME]:Companyname
| Code Block |
|---|
[AGILOFT_HOME]/bin/ew-control -d |
...
| Companyname |
|---|
...
hp |
Escalate an Issue
...
If the previous diagnostics do not reveal the cause of the performance issue, then it should be escalated for further assistanceor if your system is hosted by
| Companyname |
|---|
Submit Performance Issues for Further Investigation
Submit Log in to our Support Portal and submit a support ticket with ticket with the following information:
- Steps to reproduce the issue.
- Knowledgebase credentials.
- Impact assessment: how many people is this performance issue affecting?, including the number of people the issue is affecting.
Thread dumps and log filesAttach the thread dump and logs. If the server is hosted by
, grant access to the location of the logs and document the location in the ticket.Companyname
| Hide If | ||
|---|---|---|
| ||
Go to Advanced Perform Advanced Level InvestigationSelf-hosted developers and experienced system administrators may refer to the article Advanced Investigation of Performance Issues for further investigation. |
...