...
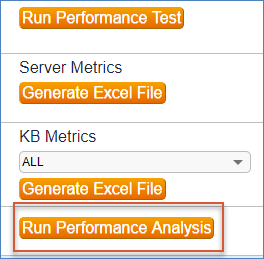
Before completing any other steps to investigate server performance issues, run the performance analysis Python script, performance_analysis.py. In most cases, you need access to the server file system to run this script. However, in any release later than 2019_01 r195525 dated after 08/01/2019, you can run the script by opening the administrator console, going from the admin console by going to Debugging > Performance, and and clicking Run Performance Analysis:
If your system is running an earlier release, you can run the script manually from the command line. Download the script here: performance_analysis.py.
This script . The analysis is designed to identify the specific activities that may be causing performance problems. It checks the CPU and memory utilization and produces a summary of events and activities for the day. The summary can help determine if an incorrectly configured rule or action should be investigated as a potential cause of performance issues.
The automated report opens in a new window, including sections for main activities, top CPU processes, and VMStat output. The report captures activities beginning at 12:01 a.m.

| Note |
|---|
If you need to run an analysis on a different time frame, or if your system is running a release earlier than 2019_01 r195525 dated 08/01/2019, you can |
| Note |
When you run the script from the admin console, it captures activities beginning at 12:01am. When you run the script manually, you can configure the time frame to use a different starting pointmanually from the command line if you have direct access to the server. Download the script here: performance_analysis.py and run it with this command: |
You can also configure your server to gather and store performance data for GUI operations, so you can analyze performance over time. To turn on data gathering, go to General > Variables in the admin console and set the Save Performance Data variable to Yes. When this setting has been enabled long enough to gather data, ideally at least a month, you can go to Performance > Server Metrics or Performance > KB Metrics to see the data.
Diagnose Issues on a Self-hosted Server
...
- Check your hardware configuration to confirm that it follows
System Requirements for hardware.Companyname - Run a performance test through the Administrator Consoleto validate the hardware configurationthat the hardware meets Agiloft standards. The test takes about ten minutes and strongly impacts performance while it's running, so it is best performed outside of business hours. See Optimizing System Performance for additional details on this expected results of the performance test and more detail on other aspects of your system that can affect performance.
...
Run
| Companyname |
|---|
Jboss JBoss is the primary process for the
application. On Linux servers, the process appears as Companyname java. On Windows servers, it appears as ewjboss. Running diagnostics on the process and reviewing log files can help identify any performance issues.
...
If a performance issue occurs while executing a particular set of steps in the interface, repeat the steps and take a Jboss JBoss thread dump at the same time. To take a thread dump, run the following command on the server as root or an administrator, substituting the directory where
is installed for [AGILOFT_HOME]:Companyname
...
| Code Block |
|---|
[AGILOFT_HOME]/bin/ew-control -d hp
or
[AGILOFT_HOME]/bin/ew-control -d all (sometimes the -d hp option fails but -d all succeeds) |
Escalate an Issue
If the previous diagnostics do not reveal the cause of the performance issue, or if your system is hosted by
| Companyname |
|---|
...
- Steps to reproduce the issue.
- Knowledgebase credentials.
- Impact assessment, including the number of people the issue is affecting.
Thread dumps and log files. If the server is hosted by
, grant access to the location of the logs and document the location in the ticket.Companyname
| Hide If | ||||||||||||
|---|---|---|---|---|---|---|---|---|---|---|---|---|
| ||||||||||||
| ||||||||||||
Related articles
Perform Advanced Level InvestigationSelf-hosted developers and experienced system administrators may refer to the article Advanced Investigation of Performance Issues for further investigation. |